Dashboards, KPIs, and Actionable Insights for Successful Marketing Performance
- Hooman Hashemi

- Jul 3, 2023
- 6 min read
Content:
Marketing reporting is a vital aspect of any effective marketing strategy. It involves collecting, analyzing, and presenting data related to marketing activities, enabling businesses to measure campaign effectiveness, identify trends, and make informed decisions to optimize marketing efforts. This is an quick exploration of marketing dashboards, KPIs, and actionable insights.

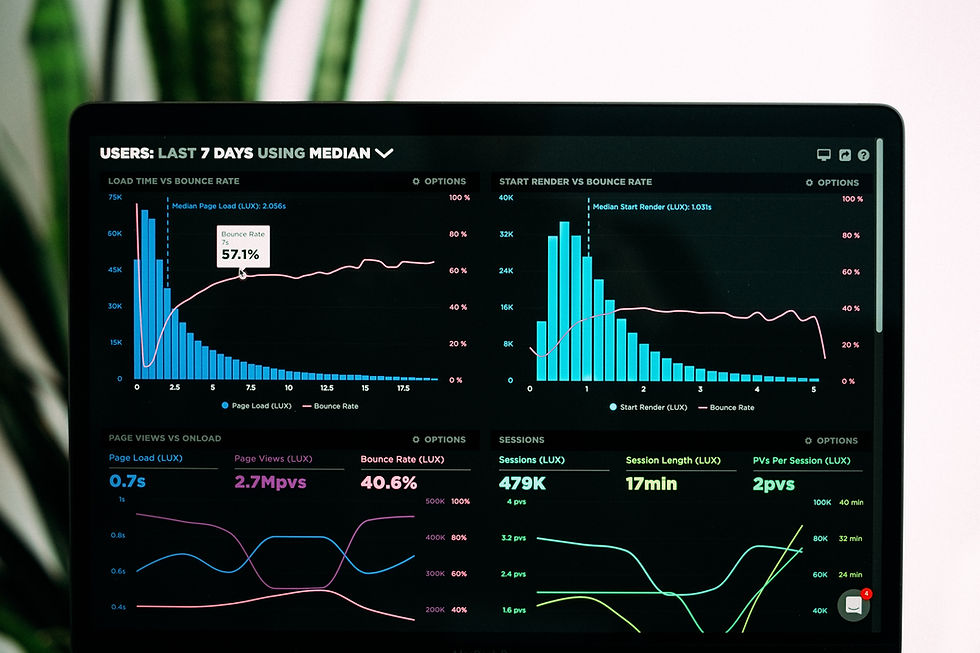
Reprots & Dashboards 101: A key tool in marketing reporting is the reporting dashboard. This centralized hub allows marketers to view and analyze performance metrics from various advertising and marketing platforms, providing a holistic view of campaign-level insights for stakeholders. Similar to the diagnostics and dials in a sports car, a digital marketing reporting dashboard consolidates relevant information to guide strategic action through data analysis. Digital marketing reporting dashboards go beyond data presentation; they offer interactivity and customization options, allowing users to manipulate the data and see real-time updates. This interactivity is a significant advantage over traditional reports, which present static information. Dashboards provide an interactive, in-browser experience where viewers can explore different dimensions, adjust date ranges, and drill down into specific data points. The primary purpose of a digital marketing reporting dashboard is to provide a quick overview of the most relevant information needed to track performance metrics associated with campaign tactics and goals. It offers a visual representation of data that enables marketers to swiftly identify patterns, trends, and areas that require attention.
While "reports" and "dashboards" are sometimes used interchangeably, there are distinct differences between the two. Reports are customized presentations of data tailored for specific audiences and purposes. They provide a fully packaged data story, often delivered in PDF or slide format, with highlights and analysis already extracted for easy consumption. Dashboards, on the other hand, are interactive, live experiences where viewers can manipulate the data and explore different perspectives. Dashboards are designed for campaign-level insights and customization.

Metrics & KPIS (Key Performance Indicator):
When constructing an effective digital marketing reporting dashboard, the included metrics will depend on the specific goals and strategies of the business. It's crucial to focus on metrics directly relevant to the campaign and easily explainable to stakeholders. Including too many irrelevant metrics can lead to information overload and make it difficult to extract meaningful insights.
There is a wide range of performance metrics commonly found in digital marketing reporting dashboards.

Let's explore some examples:
Digital Marketing/Social Metrics:
Facebook CTA (Call-to-Action) Clicks: Measures the number of clicks on specific calls-to-action in Facebook ads, indicating user engagement.
Facebook Impressions: Tracks the number of times an ad is displayed on Facebook, indicating its reach.
Facebook Talking About: Monitors the number of users actively engaging with a brand's Facebook Page, such as liking, commenting, or sharing posts.
Foursquare Daily Check-Ins: Measures the number of times users check in at a business location through Foursquare, indicating foot traffic and customer engagement.
Google Customer Actions: Tracks the actions taken by customers on Google, such as phone calls, website visits, or requests for directions.
Google Map Views: Monitors the number of times a business location is viewed on Google Maps, indicating user interest and potential foot traffic.
Google Search Queries: Analyzes the keywords and search queries that lead users to a website through Google search, providing insights into user intent and search trends.
Search Engine Marketing Metrics:
Impressions: Tracks the number of times an ad is displayed in search engine results, indicating its visibility.
Clicks: Measures the number of times users click on an ad, indicating user engagement and interest.
Keyword Ranking: Determines the position of a website or ad in search engine results for specific keywords, providing insights into search engine optimization efforts.
Domain Authority: Indicates the credibility and authority of a website's domain, influencing its visibility in search engine results.
Organic Traffic: Measures the number of users who visit a website through organic (non-paid) search engine results, indicating the effectiveness of SEO efforts.
Page Speed: Assesses the loading speed of a website's pages, influencing user experience and search engine rankings.
Conversions: Tracks the number of desired actions taken by users, such as form submissions, purchases, or sign-ups.
Calculated Metrics:
ROI (Return on Investment): Calculates the profitability of a marketing campaign by comparing the return generated to the investment made.
CPA (Cost Per Acquisition): Determines the average cost of acquiring a customer or lead, indicating the efficiency of marketing efforts.
ROAS (Return on Advertising Spend): Measures the revenue generated for every dollar spent on advertising, providing insights into the effectiveness of advertising campaigns.
CLV (Customer Lifetime Value): Predicts the revenue a customer will generate over their lifetime as a customer, guiding customer acquisition and retention strategies.
Customer Retention Rate: Measures the percentage of customers who continue to engage with a business over a specific period, indicating customer loyalty and satisfaction.
High-Level Marketing/Sales Metrics:
Marketing Qualified Leads: Tracks the number of leads that meet specific criteria and are deemed more likely to become customers, indicating the effectiveness of marketing efforts in generating quality leads.
Sales Qualified Leads: Measures the number of leads that have been evaluated and deemed ready for the sales team to engage with, indicating the effectiveness of marketing and sales alignment.
Funnel Conversion Rates: Evaluates the percentage of leads that progress through the marketing and sales funnel stages, providing insights into the effectiveness of conversion strategies at each stage.
Brand Awareness: Assesses the level of recognition and familiarity consumers have with a brand, indicating the reach and impact of marketing campaigns.
Customer/Channel Engagement: Tracks the level of customer engagement across different channels, such as website visits, social media interactions, or email opens, providing insights into customer behavior and preferences.
Revenue by Source/Channel: Measures the amount of revenue generated from different marketing sources or channels, helping businesses identify the most profitable avenues for generating revenue.
Marketing spend per customer: Determines the average amount of money spent on marketing activities per customer, indicating the efficiency of marketing investments.
Customer Lifetime Value (LTV): Predicts the revenue a customer will generate over their entire relationship with a business, guiding customer acquisition and retention strategies.

Combining Metrics to Get Meaninful Result:
It's important to note that the combination of metrics included in a marketing dashboard will vary depending on the specific business, industry, and marketing objectives. Businesses should carefully select the most relevant metrics to track and regularly review and update the dashboard to ensure its effectiveness. To set up a fully functional digital marketing dashboard, it is crucial to establish a reliable and dependable data pipeline. With the vast amount of data available from different marketing channels and platforms, businesses need a structured approach to collect, process, and integrate the data into a central location for analysis and visualization. Setting up a marketing data warehouse is an effective way to streamline the data pipeline and optimize reporting workflows. Popular data warehousing platforms like Google BigQuery, Snowflake, Amazon Redshift, Microsoft Azure, and Oracle Database offer speed, accessibility, and scalability, enabling businesses to efficiently gather data from various sources and generate real-time insights. Proper data warehousing not only ensures data integrity and accessibility but also improves the speed at which reports and dashboards can be generated. For businesses looking to scale their marketing services, partnering with a vendor specializing in data pipeline engineering can be advantageous. These vendors provide expertise and support in setting up and maintaining a robust data infrastructure that can grow with the business's needs.

To illustrate the concept of a marketing dashboard, let's consider a few examples:
Example 1: High-Level Marketing Reporting Dashboard This dashboard incorporates data from various sources and analytics, such as web traffic, demographics, and ROI. It provides an at-a-glance picture of key performance metrics, visually organized for easy understanding and analysis. Marketers can quickly assess the effectiveness of their marketing campaigns, identify trends, and make data-driven decisions.
Example 2: Pay-Per-Click Performance Dashboard This dashboard focuses on pay-per-click (PPC) advertising performance metrics, including impressions, conversion rates, cost per click, and click-through rate. The clean formatting and campaign-centric analytics make the data easily digestible, allowing marketers to monitor the success of their PPC campaigns and optimize their strategies accordingly.

By utilizing digital marketing reporting dashboards, businesses can effectively communicate marketing performance results to clients and stakeholders. These dashboards provide a visual representation of data that goes beyond static reports, enabling stakeholders to interact with the data, explore different dimensions, and gain valuable insights.
Finally, marketing reporting, facilitated by digital marketing reporting dashboards, plays a crucial role in measuring and optimizing marketing efforts. By providing a centralized view of performance metrics, these dashboards help businesses track campaign effectiveness, identify trends, and make data-driven decisions. The choice of metrics and the design of the dashboard should align with the specific goals and strategies of the business. With the right data pipeline and infrastructure in place, businesses can leverage marketing reporting dashboards to unlock actionable insights and tell compelling data stories.